3.8 Importance of Linear Phase (or Constant Group Delay)
In some applications such as analog signal transmission and audio amplification, the system should ideally have an output identical to its input . Given that obtaining is often unfeasible due to propagation delays inherent of communication channels and electronic systems, a more realistic target is to obtain , a delayed version of the input. From the time-shift Fourier property (see Appendix B.1), the delay by corresponds to a linear phase in frequency domain. Hence, having a linear phase is an important property of a system to achieve distortionless transmission, i. e., letting a signal pass without distortion.
A linear phase filter with frequency response has a phase that corresponds to a line segment in the passband (the phase behavior in the stopband is considered irrelevant). In practice, the line has a negative slope because a positive slope would correspond to a non-causal behavior (the output would be an anticipated version of the input signal). Hence, it is convenient to define the group delay as:
|
| (3.44) |
Similarly, the discrete-time version is
|
| (3.45) |
with .
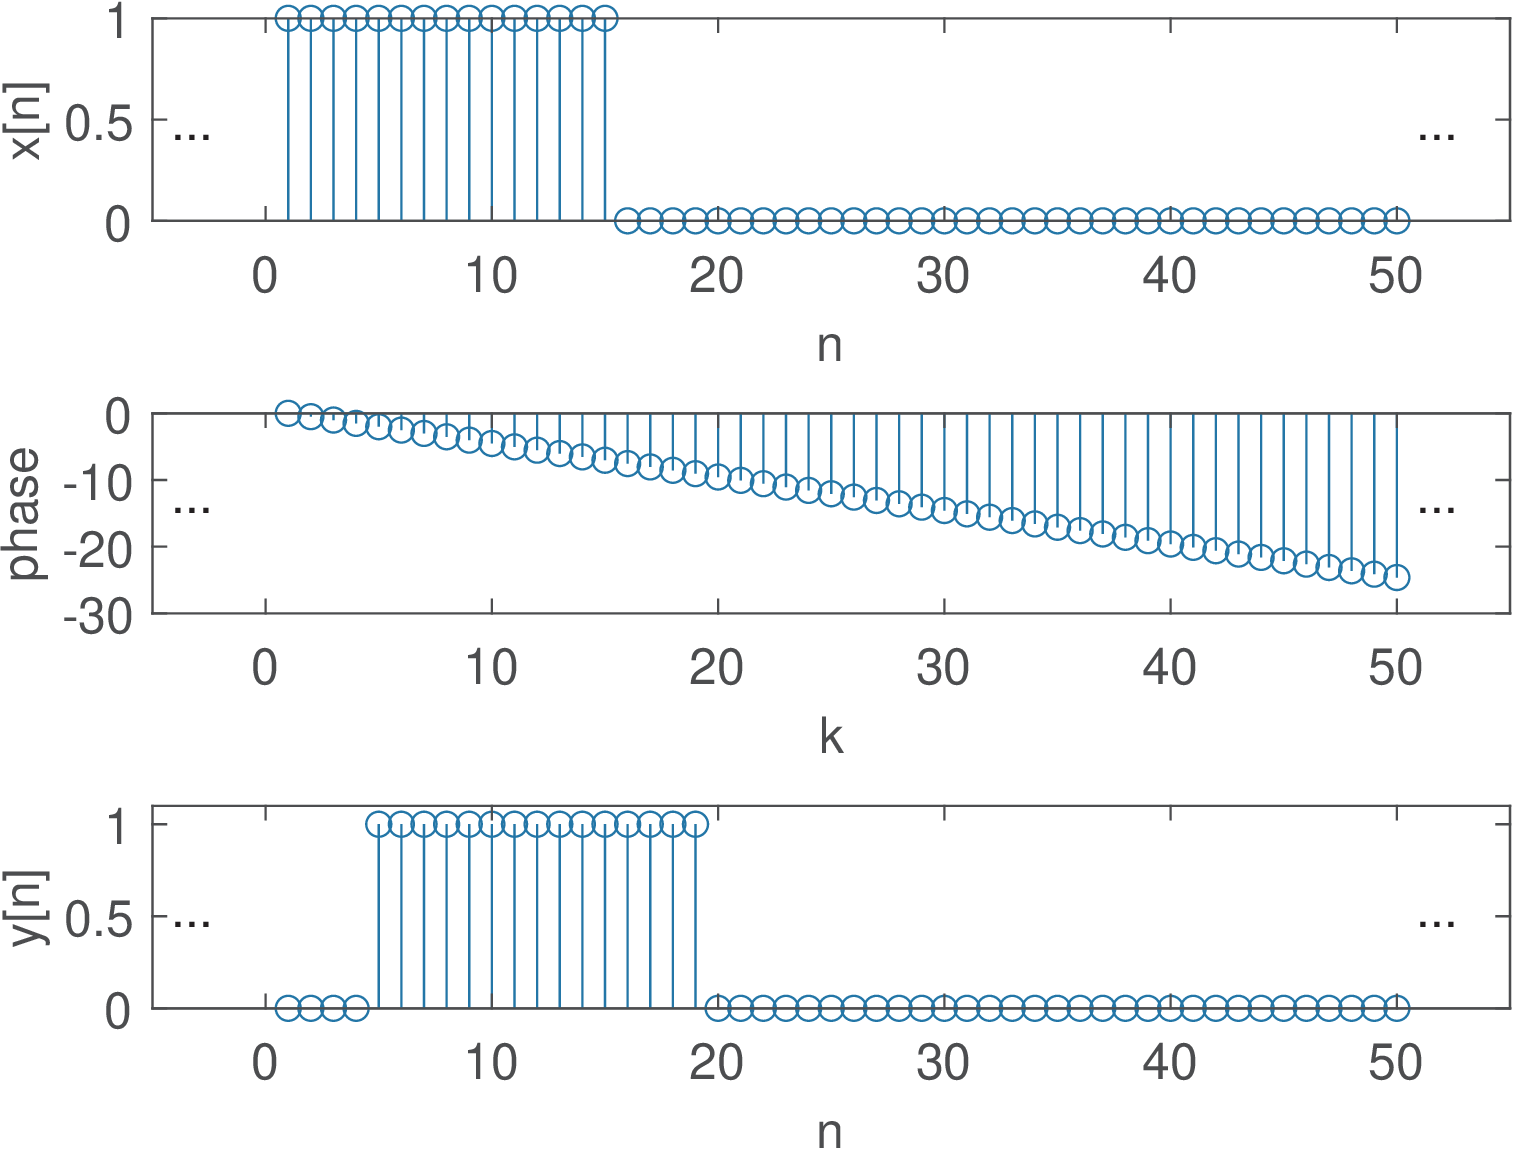
Example 3.8. Impact of the system phase on the output signal. To help understanding the practical importance of a system with linear phase, it is adopted a periodic pulse with (number of non-zero samples in a period) and period (see Example 2.11). The experiment is to obtain by multiplying the DTFS of by , where . Listing 3.10 carries out the operation, including the conversion of to .
1%Specify: N-period, N1/N-duty cicle, N0-delay, k-frequency
2N=50; N1=15; N0=4; k=0:N-1;
3xn=[ones(1,N1) zeros(1,N-N1)]; %x[n]
4Xk=fft(xn)/N; %calculate the DTFS of x[n]
5phase = -2*pi/N*N0*k; %define linear phase
6Yk=Xk.*exp(j*phase); %impose the linear phase
7yn=ifft(Yk)*N; %recover signal in time domain
Figure 3.24 illustrates the result: is a perfect delayed version of . The middle plot shows the phase that was added to the original phase of . The magnitude of was left unchanged but that would not be enough to keep the shape of in case the phase was not linear with frequency.

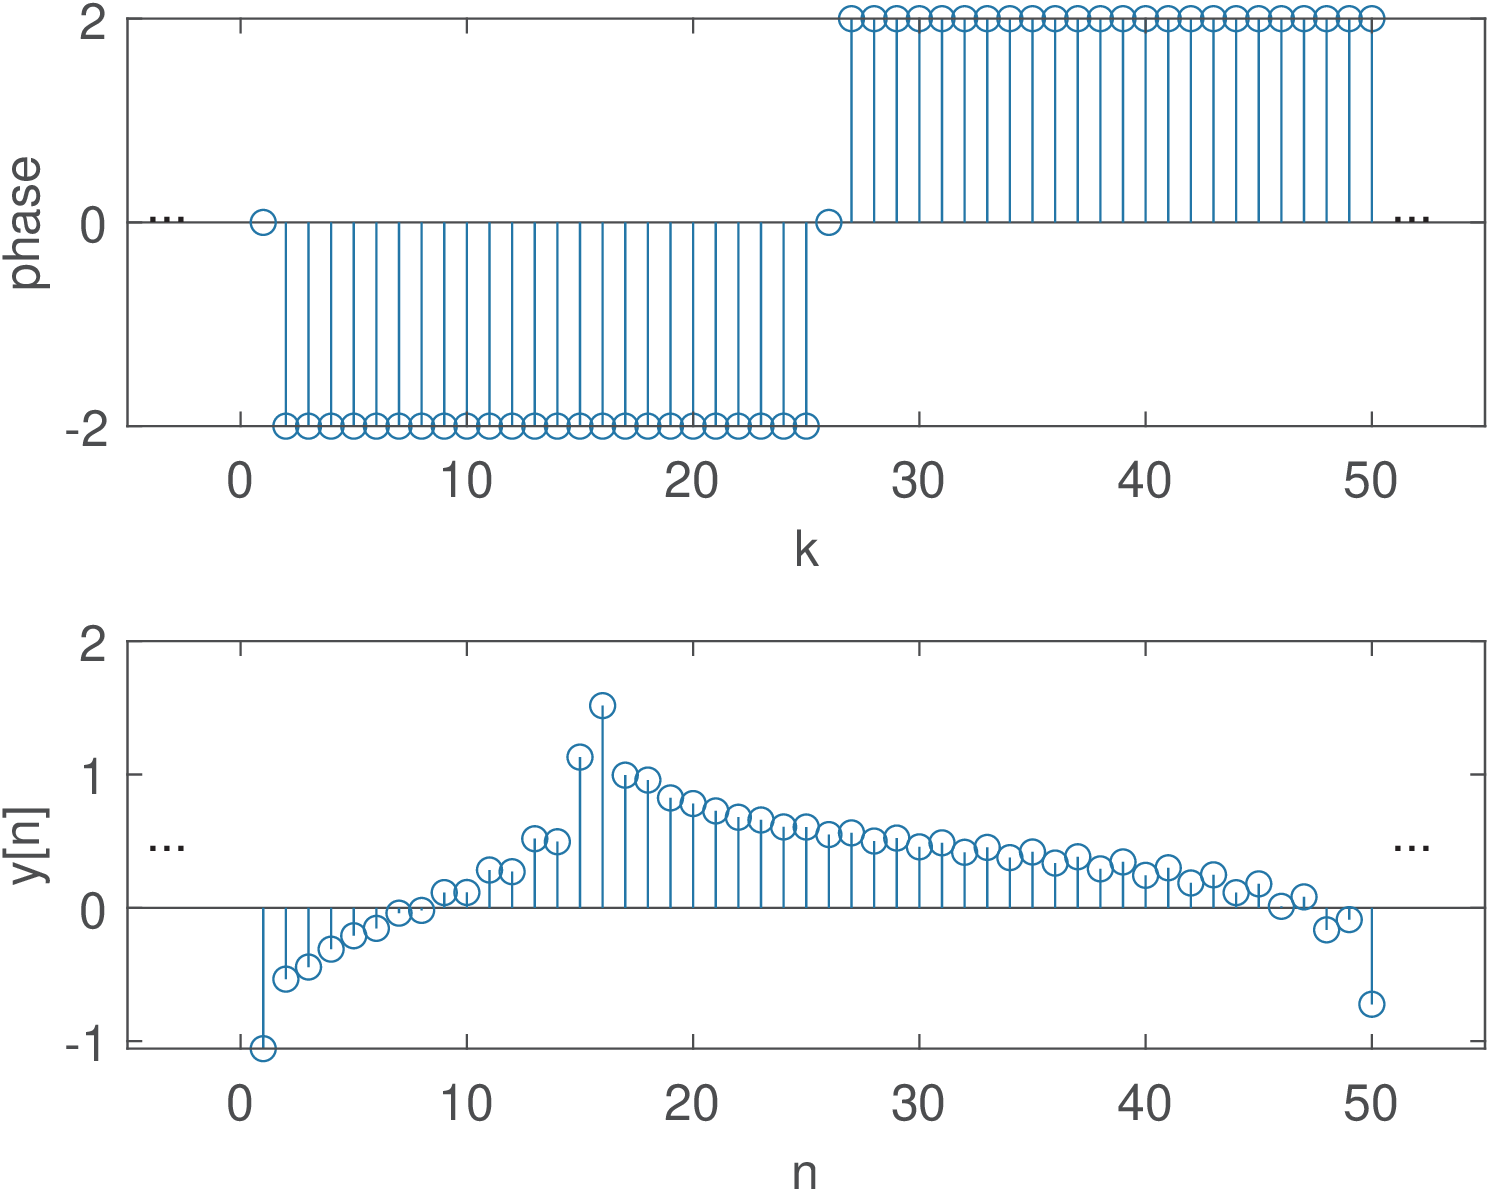
To be contrasted with the linear phase case, Figure 3.25 provides an example where the phase is 0, 2 or rad, as depicted in the top-most plot. In order to assure that is real, the phase is an odd function to preserve the Hermitian symmetry.

Note that in the case of Figure 3.25, the pulses in are severely distorted due to the effect of a non-linear phase.
Considering continuous-time (same is valid for discrete-time), a linear phase avoids distorting an input signal because the system delays all components of by the same time interval . To obtain that, a linear phase system adds to the input signal component with frequency , a phase that is proportional to (the larger , the larger the phase added by the system). The following example concerns this aspect.
Example 3.9. A linear phase allows components with distinct frequencies to be delayed by the same angle. For example, assume components corresponding to and 400 rad/s with s. The phases are 800 and 1600 rad, respectively. On the other hand, if these two components pass a system that adds a fixed phase rad to both, the delays would be 6 and 3 s, respectively, which would potentially distort the delayed version with respect to the original signal .
For non-linear phase filters, the group delay must be interpreted as an average delay that is frequency-dependent (compare Figure 3.50 and Figure 3.51).11
Example 3.10. Gaussian filter and minimum group delay. In some applications, such as digital communications, minimizing the group delay is important to achieve low latency. In this case, the Gaussian filter is competitive because it has the minimum possible group delay. As a consequence, this filter has no overshoot to an input while minimizing the rise and fall time intervals. Its non-causal (and ideal, which requires truncation in practice) impulse response is
|
| (3.46) |
where controls the 3-dB bandwidth BW. More specifically, depends on the product of BW and the symbol period as follows:
|
| (3.47) |
The frequency response of this filter is and decreases with but is not zero for finite .