3.3 A Quick Discussion About Filters
This section presents a brief introduction to a special class of systems called LTI filters, which typically have the characteristic of being frequency-selective. LTI systems will be further discussed in Section 3.4 but the goal here is to provide concrete examples on frequency-selective filters, due to their importance in DSP. Other filters will be discussed, but this section starts with the two most common filters: lowpass and highpass.
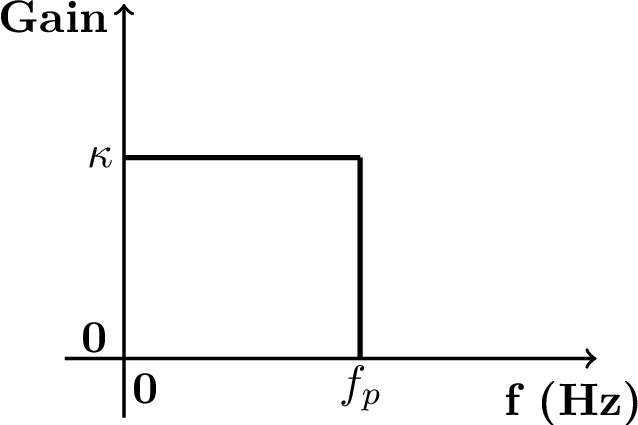
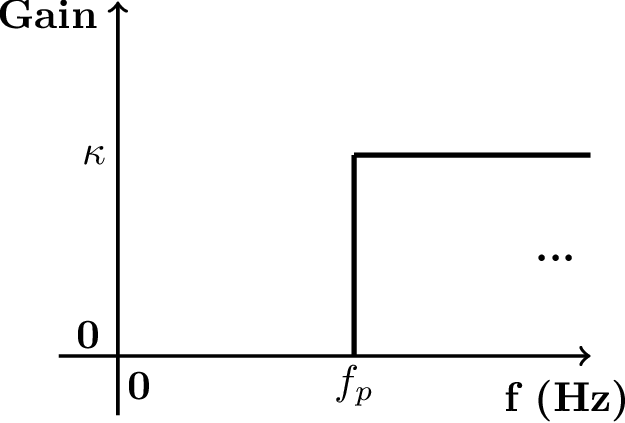
The lowpass filter is characterized by attenuating (or rejecting) the frequency components that are above a given frequency called bandpass frequency , while providing a gain to the frequency components from 0 to . The name lowpass is used because the filter allows the low-frequency components of to “pass” and compose the output. Similarly, the highpass tries to reject the components of that are located from 0 to its in the frequency spectrum, while keeping those higher than .
(a)
Lowpass |
(b)
Highpass |
Figure 3.1(a) and Figure 3.1(b) depict the ideal specification of low and highpass filters, respectively. These figures only illustrate the magnitude (gain ) and, at this moment, the phase is assumed to be zero.
Example 3.1. Lowpass and highpass filtering examples. For example, assume a signal ( in seconds) is the input to the lowpass filter of Figure 3.1(a) with , and Hz. The output would be because the component of frequency 200 Hz would be filtered out. If the same is the input to the highpass filter of Figure 3.1(b) with , and Hz, the output would be . In this case, besides eliminating the lowpass component, the filter imposed a gain of 4 to the amplitude of the 200 Hz component.
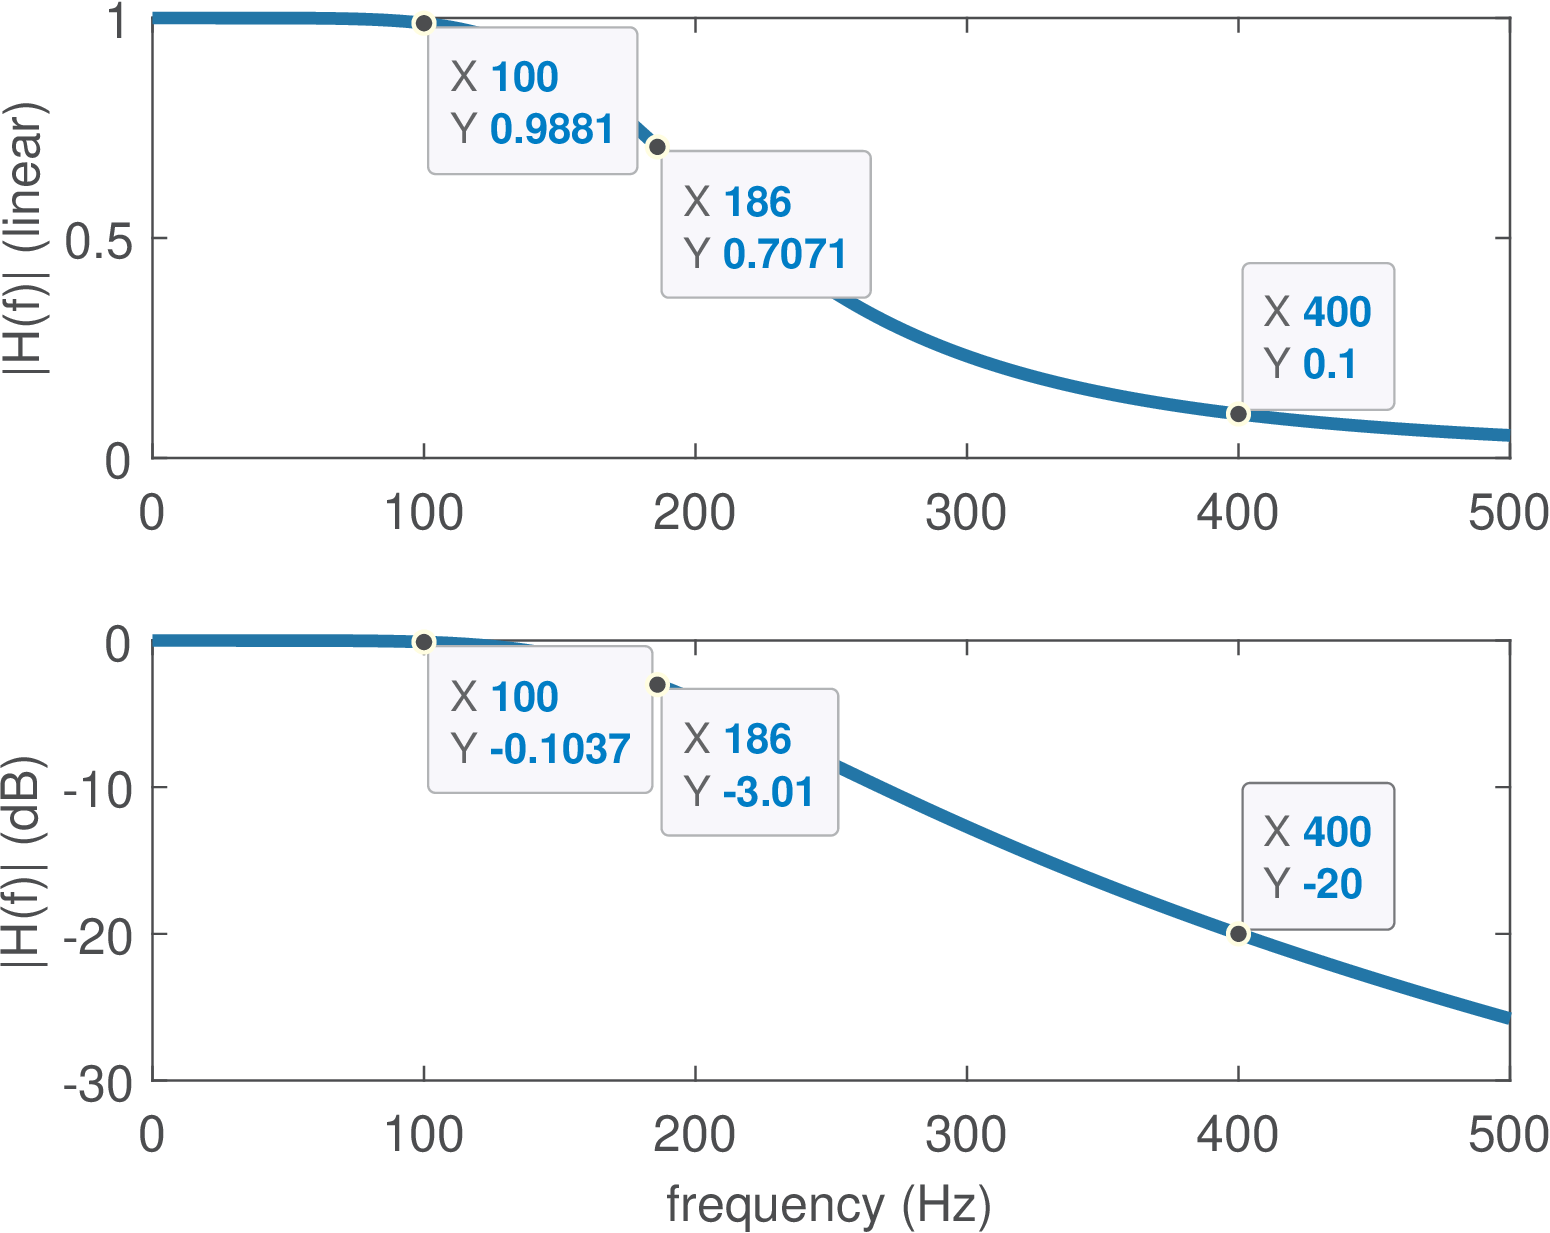
Figure 3.2 shows the magnitude of the frequency response of a (second order analog) filter. This figure should be contrasted to the ideal case of Figure 3.1. In practice the filter gain cannot instantaneously change from 1 to 0 as idealized in Figure 3.1. Instead, this variation (the attenuation rolloff) depends on the filter order and creates a transition region that is defined as the range of frequencies between and the stopband frequency .
3.3.1 Cutoff and natural frequencies
Besides and , another frequency of interest is the so-called cutoff frequency . Assuming the filter gain at the passband is , the cutoff is the frequency for which the linear gain is . The cutoff indicates the frequency in which the filter attenuates a signal component to half of its power at the passband center. For example, assume an input signal has a component with power , which is passed through a highpass filter with unitary gain at passband and cutoff frequency . This component will show up at the filter output as , which has power , corresponding to half of the original power. In dB scale, the cutoff frequency corresponds to a gain of dB, as illustrated in Figure 3.2 for a lowpass filter with gain at DC.
The cutoff frequency should not be confused with the natural frequency, which is detailed in Figure 3.19. Table 3.2 is a useful reference for the special frequencies used in signal processing.
| Symbol | Description | Reference |
| or | Cutoff frequency: where gain falls by ( dB) | Figure 3.2 |
| Natural frequency, for example, of a resonator | Figure 3.19 | |
| Center frequency of a pole | Figure 3.19 | |
| Passband frequency | Figure 3.2 | |
| Stopband (or rejection) frequency | Figure 3.2 | |
| Sampling frequency (typically in Hz or samples per sec.) | Eq. (1.25) | |
| Nyquist (or folding) frequency | Eq. (2.36) | |
3.3.2 Filter masks
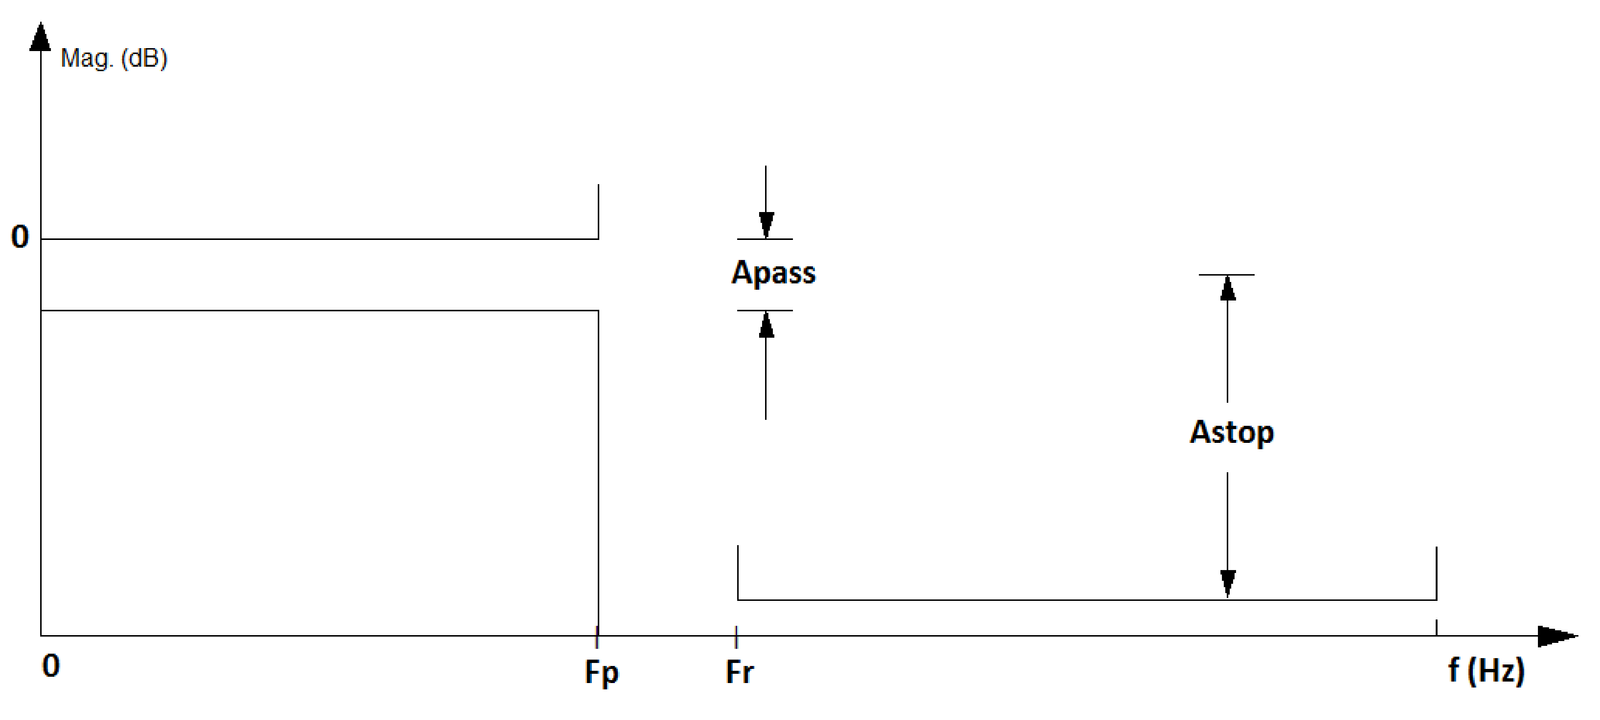
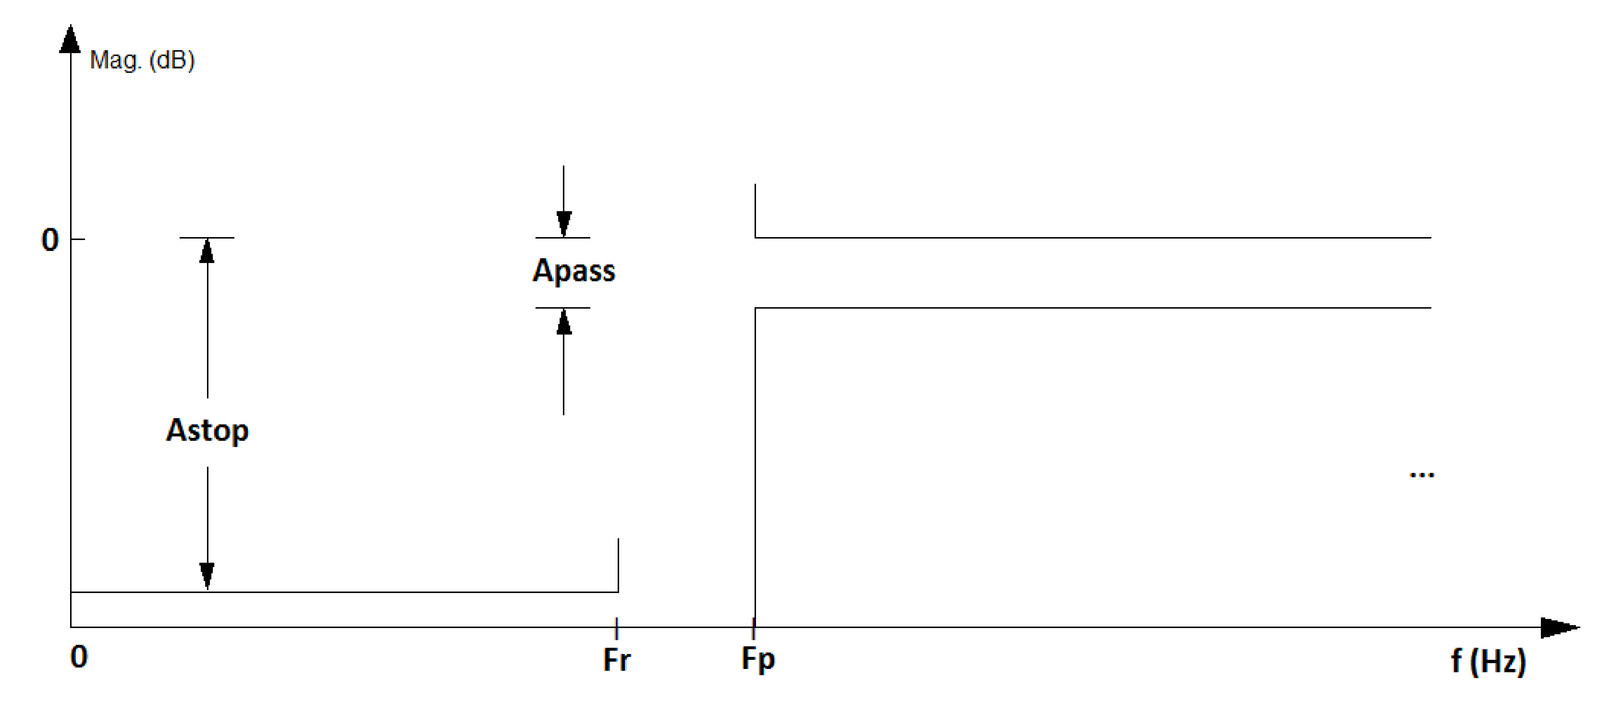
The filter designer often has a specification mask that should be obeyed. The passband and other special frequencies are used to described the mask.
(a)
Lowpass. |
(b)
Highpass. |
Figure 3.3(a) and Figure 3.3(b) depict masks for low and highpass filters, respectively. In this case, the values Apass and Astop indicate the maximum and minimum attenuation in dB for the passband and stopband, respectively. These bands are indicated by the frequencies Fp and Fr, for pass and rejection bands.
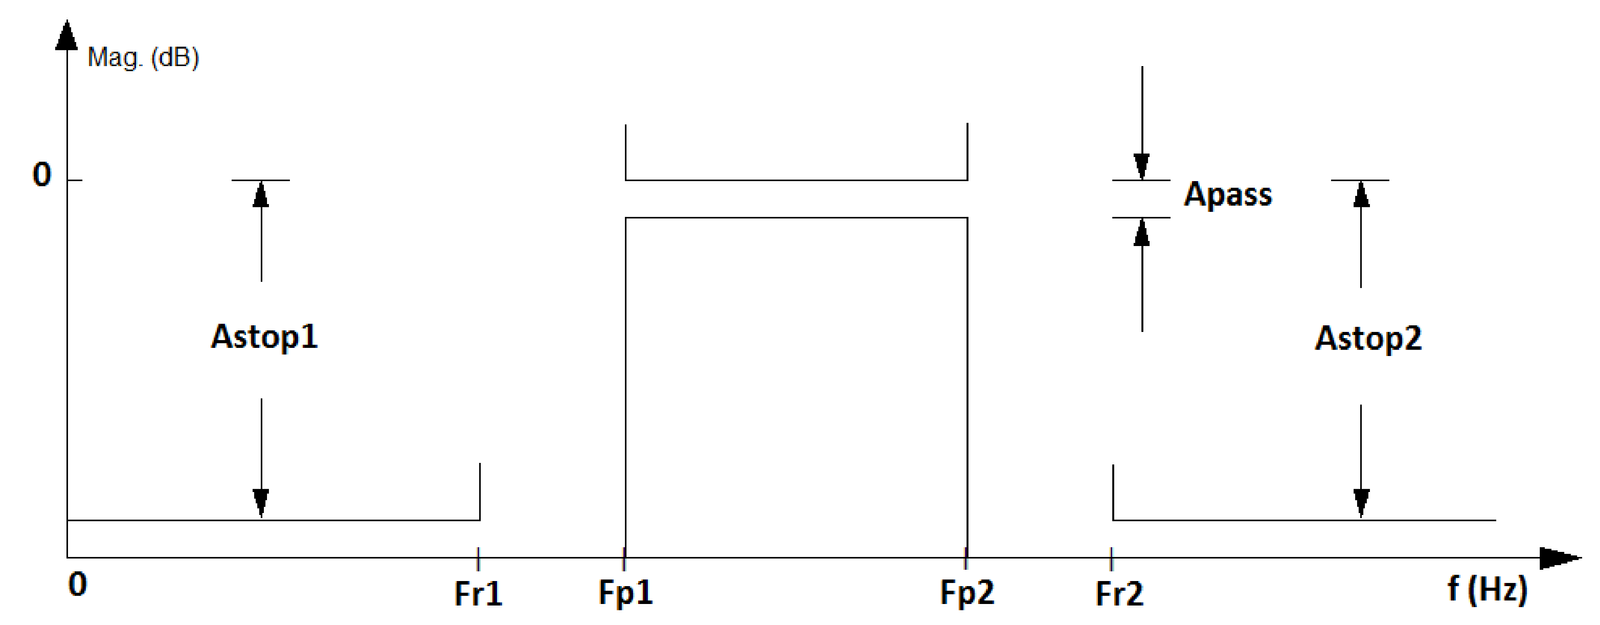
Besides lowpass and highpass, some other popular filters are the so-called bandpass and bandstop (or band-reject) filters. Figure 3.4 shows a bandpass specification.
The goal of this section was to provide an overview of filtering. Appendix B.11 presents a brief review of the most important properties of systems and the next section discusses LTI systems.