A.5 Q function
-
One just needs to know for positive because
(A.16) - When expressed in dB, it is used .
- , where erfc is the complimentary error function.
- Matlab provides the qfunc in the comm toolbox. In case this toolbox is not available or using Octave, it is possible to use the erfc function as follows: y = 0.5*erfc(x/sqrt(2)). See ak_qfunc.m and ak_qfuncinv.m.
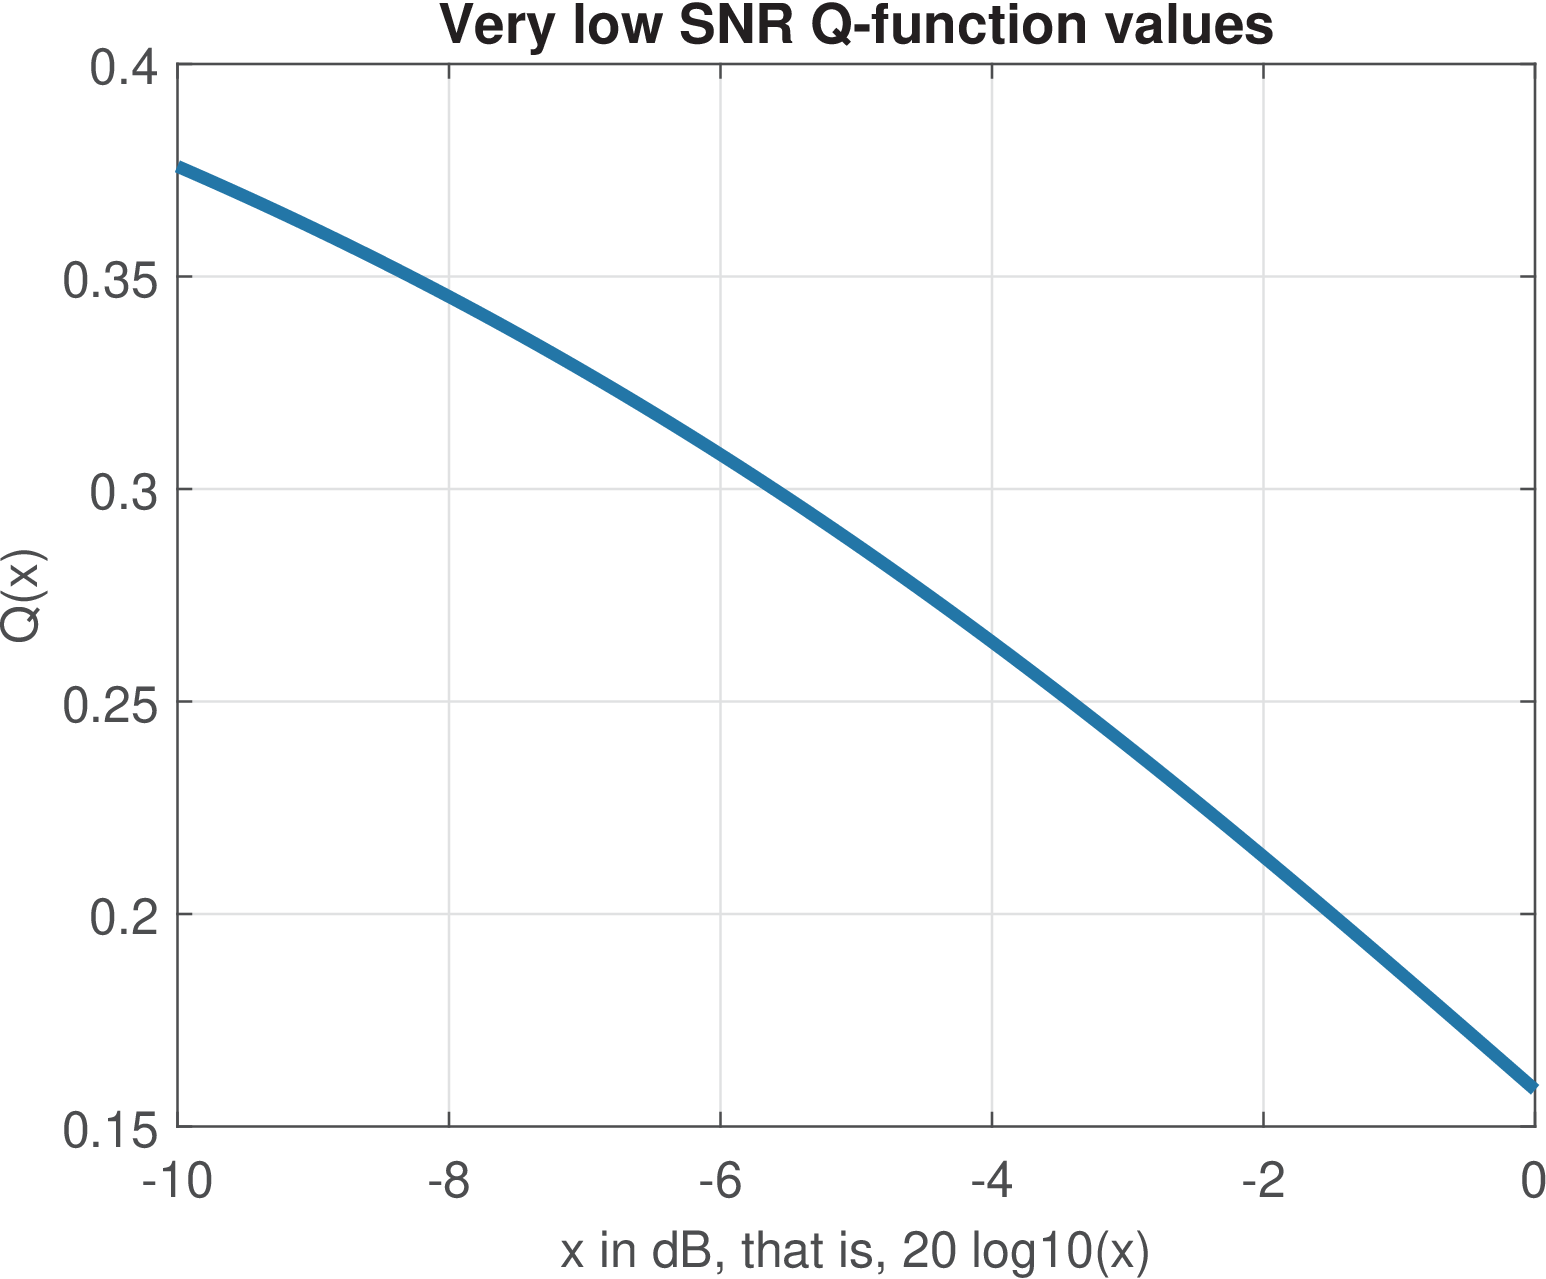
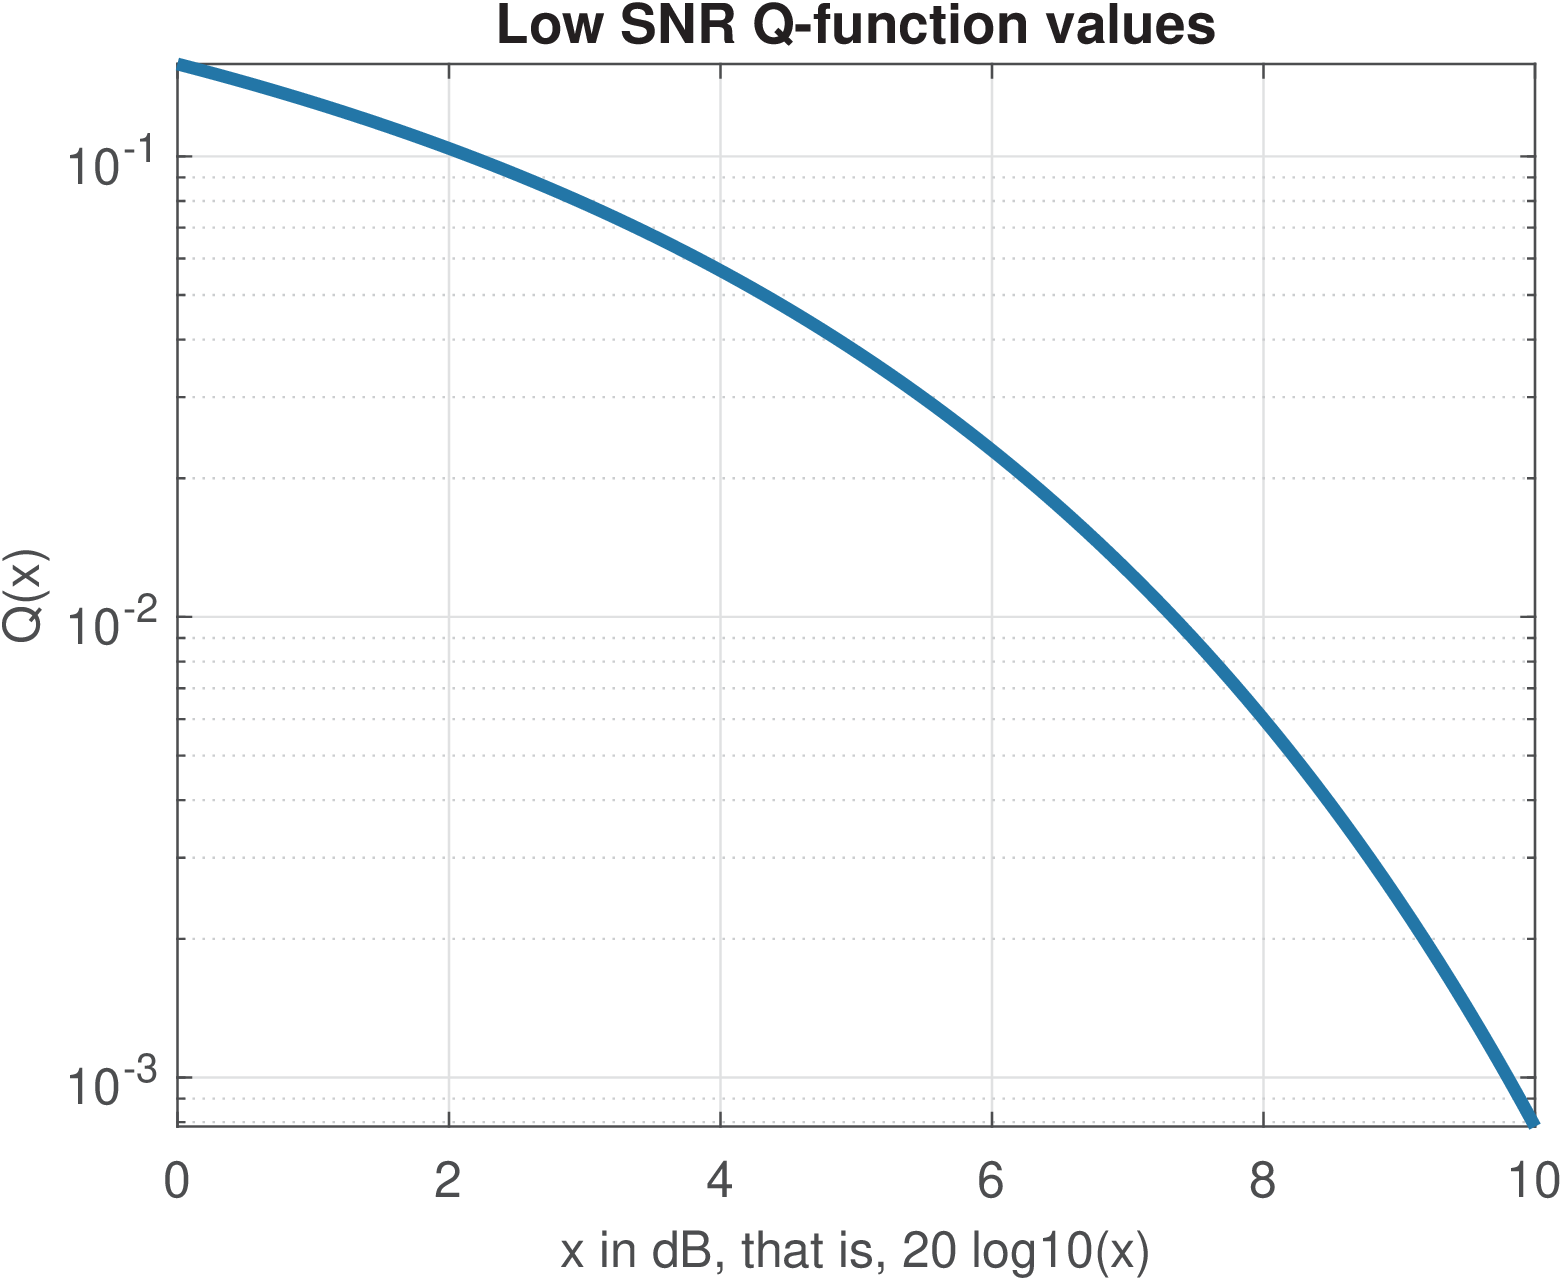
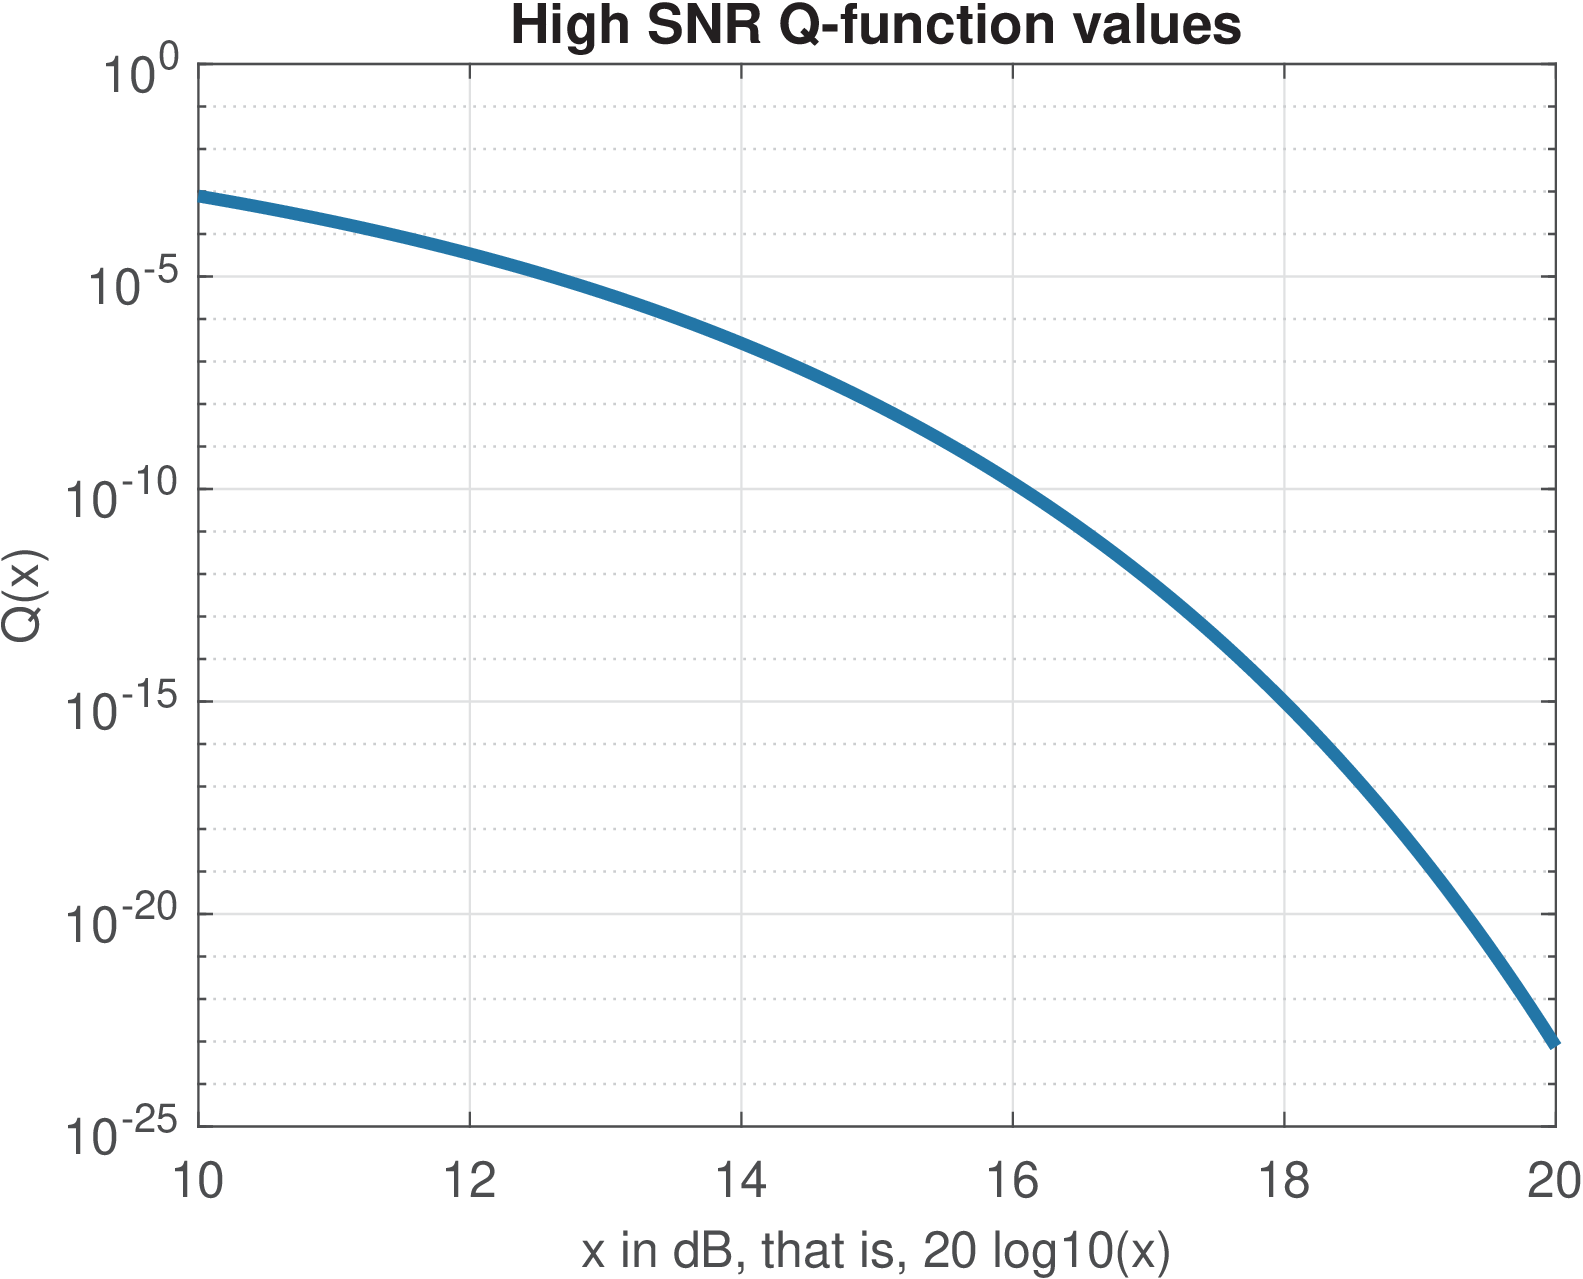
The Q values for three different ranges of its argument are shown in Figure A.1(a), Figure A.1(b) and Figure A.1(c).
A Q function approximation that is good for :
|
| (A.17) |
An accurate approximation (less than 1.2% of error) is:
|
| (A.18) |
The expression is valid for and for one should use . The function ak_qfuncApprox implements Eq. (A.18). In case you have Matlab, the code below compares it with Matlab’s qfunc.


