1.16 Exercises
Unless specified otherwise, assume that the signals are in volts and were obtained over a resistor of 1 ohm. Always indicate the units in your answers and graphs.
- f
1.1. - Both continuous-time and the discrete-time signals consist of pulses with a limited duration (finite support). Their amplitudes are equal to three for and , respectively, and zero otherwise. a) What are the values of when , and ? b) What are the values of when , and ?
- f
1.2. - An ADC uses bits per sample and sampling frequency Msps. a) What is the respective bit rate in bits per second? b) How many megabytes are needed to store 1 hour of a signal digitized with this ADC and stored in a binary “raw” format (without compression or a file header)?
- f
1.3. - Using an Internet browser, practice choosing commercial ADCs and DACs. Some companies of interest are Analog Devices, Maxim and Texas Instruments. Use their “parametric search” tools. Assume you have to choose chips for three projects with distinct requirements: 1) the fastest ADC and DAC with at least 16 bits per sample, 2) Low cost chips with 8 bits per sample to work with up to 10 kHz and 3) high precision chips to work with around 100 Hz in medical applications. In your comparison, indicate at least resolution, speed, price, power consumption, supply current and if the data bus is serial or parallel and inform the interface (e. g., SPI). Extra parameters you may include are full scale range (FSR), total harmonic distortion (THD), effective number of bits (ENOB) and offset error.
- f
1.4. - Get familiar with digitizing systems and boards, which are sometimes called DAQ (data acquisition)
boards. Calculate the storage space and transfer rate for digitized signals (visit [ url1bww] for extra
information). a) Calculate the total space in megabytes (MB) for storing 30 minutes of a signal sampled at
the maximum rate of the following data transfer technologies:
- PCI: 2133 Mbit/s (266.7 MB/s)
- Serial ATA (SATA-300): 3000 Mbit/s (375 MB/s)
- USB 2.0: 480 Mbit/s (60 MB/s)
- Serial RS-232 (max): 0.2304 Mbit/s (0.0288 MB/s)
b) Assume you need to use a 16-bits A/D process to achieve the desired SNR, what is the maximum sampling rate that needs to be supported for each interface above? c) Describe in high-level a digitizer system to sustain a sampling rate of 40 MHz and store 3 hours of a signal. Choose the data transfer technology, total hard disk space, etc.). d) Considering you must use USB 2.0: what is the maximum sampling rate the system could achieve in this case? e) Evaluate a Signatec [ url1sig] waveform recording product and indicate what is the maximum throughput that Signatec offers (indicate sampling rate and number of bits per sample) for recording some hours of signal into a hard disk. Note that when operating at maximum sampling rate, most acquisition boards and digital oscilloscopes store the ADC samples in a limited amount of onboard RAM, which is typically capable of storing only few seconds of signal. The discussed recording system must take into account the data transfer from onboard RAM to hard disk.
- f
1.5. - The analog signal V is digitized using a 2-bits ADC with sampling frequency Hz to create a digital signal . Assuming the first sample is obtained at s, inform: a) the values of the first four samples (just use here sampling, without quantization) and b) the values of for given that the ADC uses rounding and its output levels are , with V.
- f
1.6. - Note the several distinct meanings of the word digital depending on the context: an FPGA chip implements digital logic, the signal analyzer has both analog and digital inputs, etc. We want to discuss whether the waveform at a microprocessor data bus pin is a digital signal or not. But according to the definitions adopted in this text, not the nomenclature used in a text dealing with digital electronics. For that, we will assume two cases of a waveform observed with an analog oscilloscope: a) the amplitudes assume only two values: 0 and 5 V, and b) the waveform corresponds to non-ideal pulses, with e. g. non-zero rise and fall times. In these two cases, what are the signal categories according to Table 1.1)?
- f
1.7. - Draw the graph of .
- f
1.8. - Let be the amplitudes of the three samples (, 1 and 2, respectively) of a discrete-time obtained by sampling a speech signal. a) Describe the result of a DT/S conversion of to a sampled signal with sampling period s and draw the graph of specifying the abscissa in seconds. b) What are the amplitude values of at and s?
- f
1.9. - a) Manually (do not use a computer) draw the graph of the sampled signal indicating values at both abscissa and ordinate.
- f
1.10. - Given
as depicted in Figure 1.70, clearly draw the graphs of a)
,
b)
and c)
.
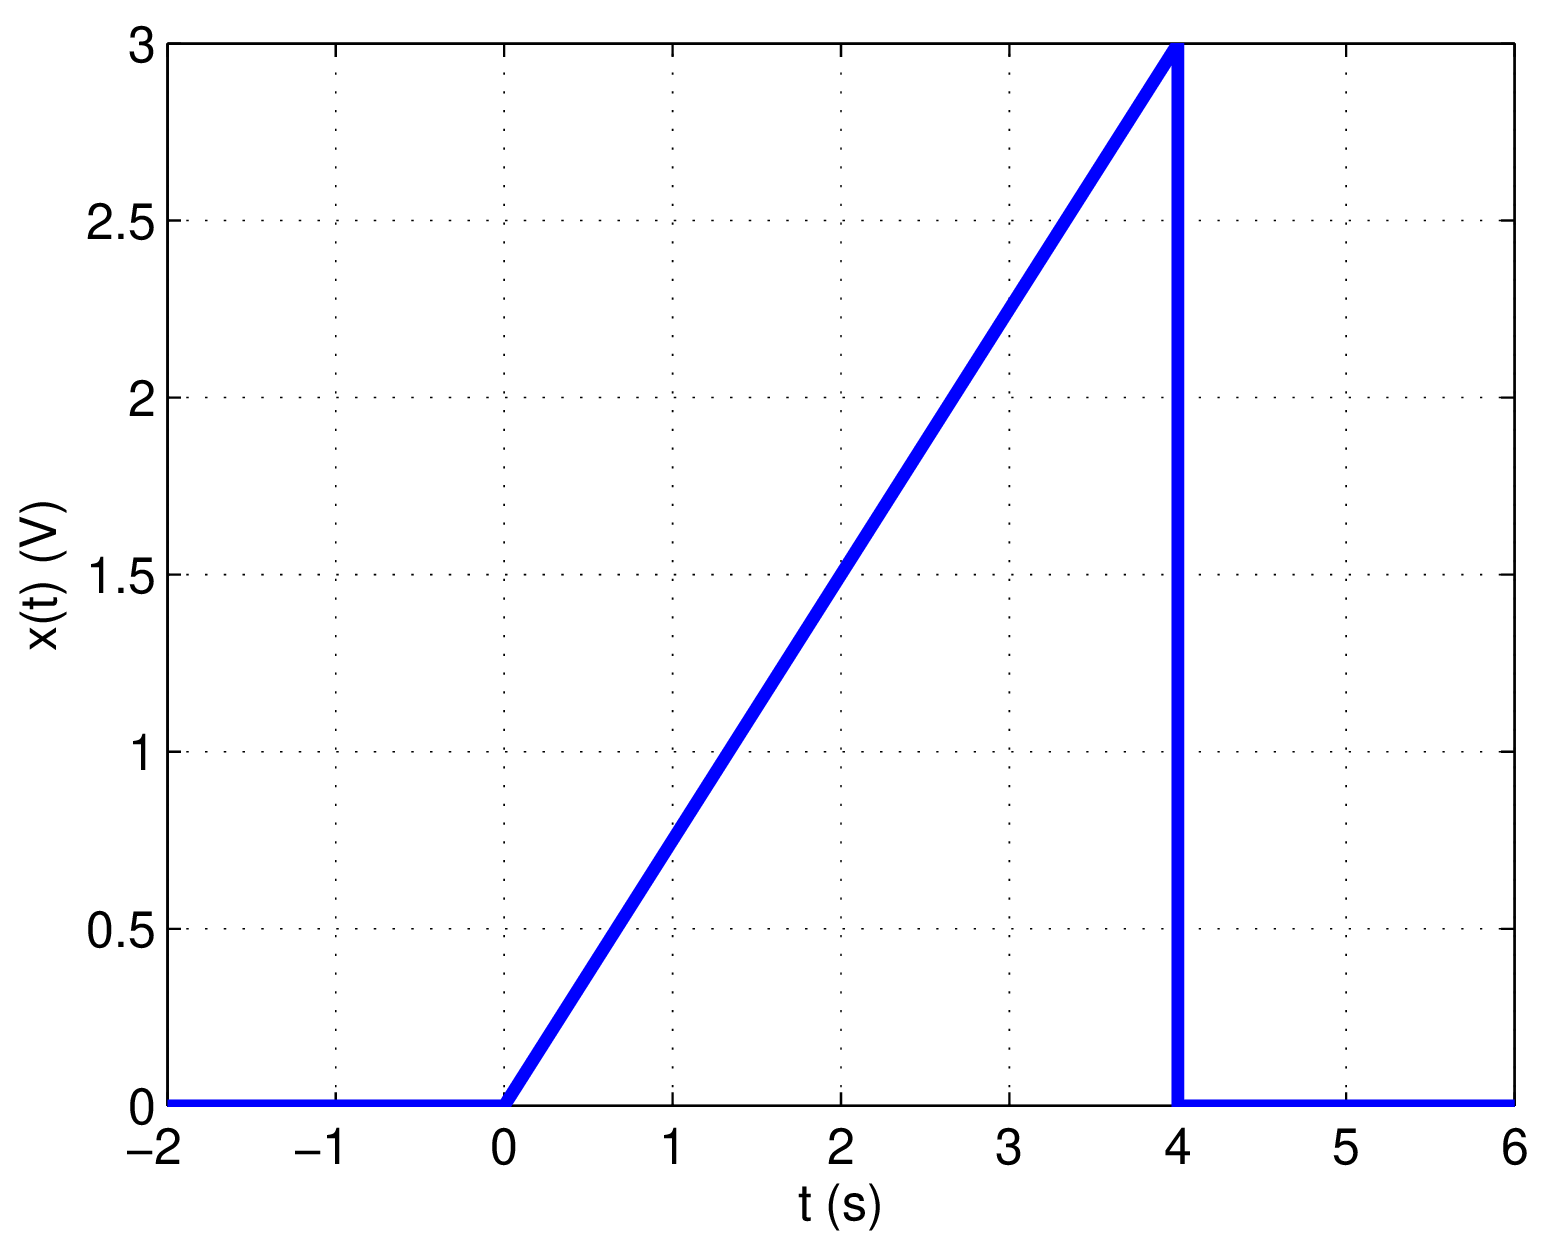
Figure 1.70: Example of continuous-time signal. - f
1.11. - a) Manually draw the graph of . b) Do the same for the signals: , and . c) Convert to a sampled signal adopting kHz and draw the graph of .
- f
1.12. - Carefully draw the signals: a) , b) and c) , d) , with s. You may use a computer to help with c) and d).
- f
1.13. - An analog signal was periodically sampled with sampling period s to obtain the sampled signal . The sampling theorem was obeyed. a) What is the analytic expression of ? b) Is this the only possible answer? For example, is a possible expression for given that s and the sampling theorem was obeyed? Why?
- f
1.14. - Four frequencies generated by an ideal piano (in Hz) are:
,
,
and
. a) When a piano song is digitized
with sampling frequency Hz,
what are the digital angular frequencies in radians corresponding to A7 and A4? b) what should be the
values of W1 and W2 such that the Matlab/Octave commands below
generate 3 seconds of a sum of two cosines, corresponding to the frequencies A6 and A5, respectively, still assuming the given ? c) Repeat a) and b) for kHz. d) Adopting kHz brings any trouble? Explain you answer.
- f
1.15. - An -bits ADC uses two’s complement to output binary numbers that correspond to integers in the range . The ADC’s quantizer is uniform with a step size mV. a) For the following input values , indicate the output in binary, its corresponding value as an integer , the decoded output and the quantization error. b) Repeat the procedure assuming the ADC uses a numbering scheme based on an offset .
- f
1.16. - A sinusoid was quantized with bits per sample using a step size and . This quantization generated the digital signal . The corresponding binary values were stored in a file using a numbering scheme with offset , but this file was wrongly interpreted with a routine that generated assuming a two’s complement scheme. Inform the 6 values of a period of the original , the properly quantized and the erroneously interpreted .
- f
1.17. - The goal is to design a uniform scalar quantizer for a discrete-time signal . It is given that is approximately uniformly distributed with mean equal to 2 and standard deviation equal to 3. a) Describe a 3-bits quantizer that minimizes the quantization error, explaining your design decisions. b) Calculate the signal to noise ratio (in dB) for the case of a 8 bits quantizer operating with the same input signal.
- f
1.18. - A 3-bits uniform quantizer has a step size V. The input is and the output . Its minimum output value is . Assume four input values V and inform: a) the graph (“stairs”) showing for this quantizer, b) the quantization error for each of these input values and c) the power in watts of considering only the four corresponding samples.
- f
1.19. - Assuming the input signal of a quantizer can be modeled by a Gaussian FDP with variance 4 W and mean 2 V. Design a 2-bits uniform quantizer that tries to minimize the quantization error. a) Draw the output versus input for this quantizer and b) calculate the quantization assuming only errors in the granular region and that the linear model for quantization is valid.
- f
1.20. - Consider you want to quantize a sinusoid with peak amplitude that is equal to 10 volts using bits. Find general expressions for the quantization SNR in terms of , using both linear and dB scales. If instead of a sinusoid your signal (to be quantized) had a Gaussian PDF with mean and standard deviation , find similar expressions for the SNR assuming the signal dynamic range is around the mean.
- f
1.21. - Use an approach similar to Example 1.61, but assume the input signal is uniformly distributed, to prove the rule of thumb that says each extra bit of an ADC increases in 6 dB the quantization SNR.
- f
1.22. - A data acquisition system uses an ADC of 12 bits. To improve its resolution, a signal conditioning board is developed, based on an automatic gain control (AGC) circuit with programmable gain. This gain can assume 16 distinct values and is represented by 4 bits. Assuming the overall system now represents a sample with bits, what is the expected improvement in the quantization SNR in dB due to the adoption of the AGC?
- f
1.23. - An eight-bits ADC uses two’s complement and the Q2.5 format. The input signal is always within the quantizer’s granular region (no saturation). The quantizer is uniform, uses rounding and its output levels match the signal dynamic range given by V. a) What is the expected mean and variance of the quantization error assuming the linear model for quantization is valid? b) What is the estimated SQNR? c) What is the new SNR if Q3.4 is adopted and what could be an advantage of Q3.4 over Q2.5?
- f
1.24. - Represent the four numbers using bits and two’s complement. a) Compare the quantized values when the following formats are adopted: Q4.3, Q3.4 and Q0.7. b) What are the corresponding dynamic ranges and step sizes for each of the three formats?
- f
1.25. - An embedded system generates the following thousand numbers xd=linspace(-1e30,1e30,1000) with Matlab/Octave (or import numpy; xd=numpy.linspace(-1e30,1e30,1000) with Python) and stores them in ROM using IEEE 754 in double precision. To reduce this amount of memory, an engineer considered the adoption of single precision, obtained with xf=single(xd) in Matlab/Octave (or xf=numpy.float32(xd) in Python). a) Calculate the required ROM size in bytes in both cases. b) The maximum absolute value of the error xd-xf. c) Is this error acceptable in your opinion?
- f
1.26. - a) Assuming xd=1e200 is a double (IEEE 754 in double precision), explain the result of converting it to 32 bits using xf=single(xd) in Matlab/Octave (you can do the same analysis in Python, if you prefer). b) Explain the discrepancy between the results of single(0.3)-0.2-0.1 and double(0.3)-0.2-0.1 in Matlab/Octave or between import numpy; print(numpy.float32(0.3)-0.2-0.1) and print(numpy.float64(0.3)-0.2-0.1) in Python.
- f
1.27. - Depict in plots the even and odd parts of .
- f
1.28. - You do not know much about a signal , but it is given that . Can be an odd signal? Why?
- f
1.29. - For the following signals, calculate the energy and power . Do they have a finite total energy or a finite average power? a) , b) and c) .
- f
1.30. - What can be said about the total energy and average power of any periodic signal?
- f
1.31. - a) The set describes the output values of a given quantizer, in volts. Assuming all elements have the same probability, what is the average energy in joules of these values? b) Consider the same values compose a discrete-time sequence . What is the average power in watts of over its support of eight non-zero samples? c) Given that the equation for both cases a) and b) is the same, discuss why the results are expressed in distinct units (joules and watts).
- f
1.32. - For each of the following signals, determine whether or not it is periodic and in positive case, its fundamental period : a) , b) , c) and d) ?
- f
1.33. - a) Classify as energy or power signals: , and , where is given in seconds. b) Calculate their autocorrelation , using the proper definition for power and energy signals, and indicate the unit of .
- f
1.34. - A signal V is sampled to obtain samples at s, where s. After A/DT conversion, these samples compose the finite-duration sequence . What are the power values (in watts) of and of , assuming for only the interval to 99?
- f
1.35. - The following commands were used to estimate the autocorrelation of a cosine: N=16; n=0:5*N-1; x=cos(2*pi/N*n); R=xcorr(x,’biased’); However, the result did not match the theoretical expression. Can you explain the reason? How could you obtain the proper result? Compare this result with Application 1.5. Why in this case autocorrelation seems to be periodic and match the theoretical result?
- f
1.36. - A sinc function (see Section A.10) centered in can be an autocorrelation? What if it was centered in seconds? What is the interpretation to the fact that the autocorrelation achieves its maximum at ? What is the interpretation for (the autocorrelation at origin) if the adopted definition were: a) for energy signals and b) for random or power signals?
- f
1.37. - A signal was obtained using the randn function in Matlab/Octave, such that it has zero mean and unity variance. What is the power of this signal? How can be transformed in a signal with mean equal to four and variance equal to nine? What is the Matlab/Octave command to generate 100 samples of using randn? What is the average power of ? Plot the following graphs: autocorrelation and probability density function of both and .
- f
1.38. - Prove that for the AWGN channel with noise uncorrelated with the input signal , the output of the received signal is simply the sum of the power of and the power of .
- f
1.39. - Assuming and , calculate the unbiased autocorrelations of and , and their crosscorrelation.
- f
1.40. - The autocorrelation of a sinusoid is . What can be said about its amplitude , angular frequency and phase ?
- f
1.41. - In case you have access to the required equipment, estimate and describe in details the quantizer used by the sound system of some personal computer (describe the “stairs”: dynamic range and step size). Try to model the DC offset.
- f
1.42. - Learn how to manipulate wav files obtained from an audio CD and evaluate their histograms. Were the signals properly digitized? All (or most) quantizer levels were used? In case you find a CDA file, note that these files (of just 44 bytes) are not the actual audio files. They are just pointers to the audio data (similar to shortcut files). In order to copy the files, you need to use a rip software such as, e. g. [ url1rip].