2.6 Relating spectra of digital and analog frequencies
If is obtained by sampling , it is convenient to relate their spectra. This is a followup of Section 1.8. Recall from Eq. (1.36) that . Hence, can be used to relate the abscissas of graphs of and . But the periodicity of should be taken into account as follows.
After a sampling frequency is specified (e. g., kHz), the value represents the frequency that will be mapped to the angle rad and its multiples in . This can be seen by
|
| (2.36) |
In discrete-time (or “digital”) signal processing, the value of is called Nyquist frequency or folding frequency. If the spectrum is zero13 for , then the values of in the range coincides with the values of normalized by in the corresponding range of . In other words:
which will be proved later on. Note that only holds if the sampling theorem is obeyed, otherwise the components of signal with frequencies in the range and will be mapped (or folded, which is the reason for calling the folding frequency) to components of with angular frequencies in the range , eventually distorting the discrete-time representation of the original . This phenomenon is called aliasing because a folded component from appears in as an “alias” or impostor.

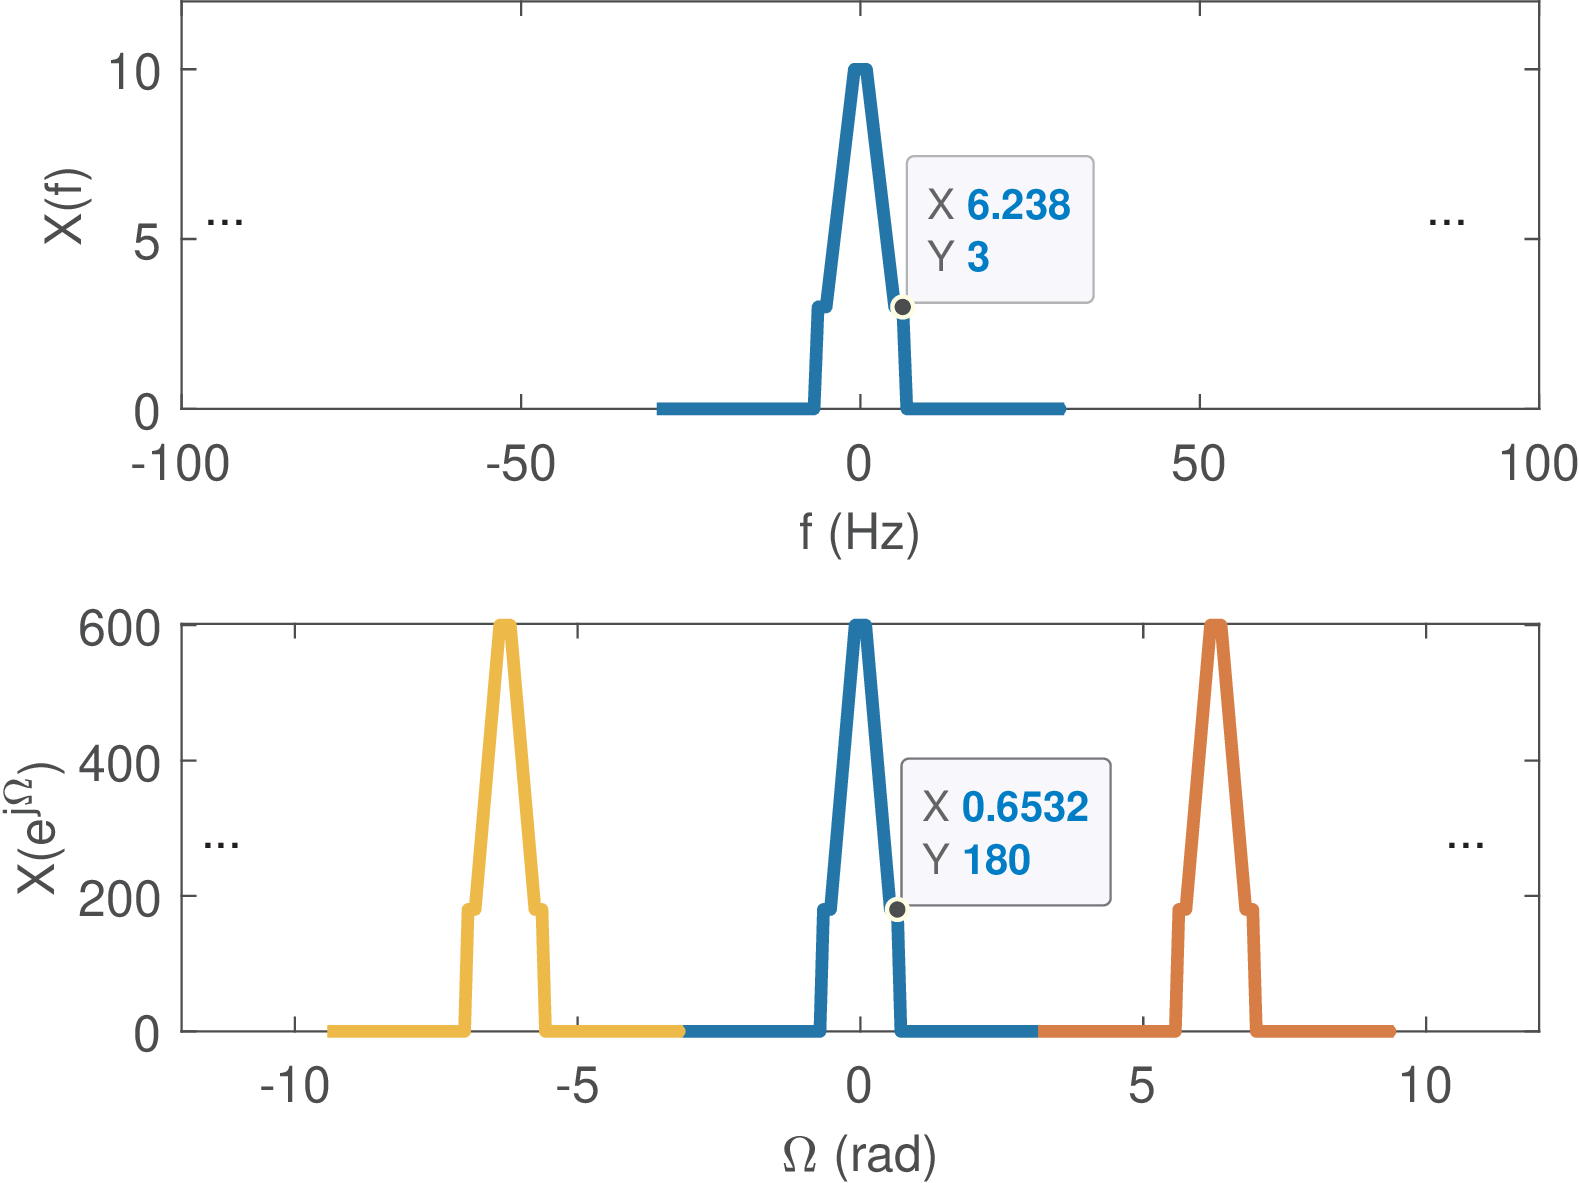
For the sake of illustration, Figure 2.19 depicts the spectrum of a continuous-time signal . It also shows the spectrum of , obtained by sampling with Hz. In this case, rad/s is mapped to rad, with the magnitude being scaled by 60, according to . This discussion aims at illustrating how the Fourier transform of and the DTFT of the corresponding (obtained from via a C/D conversion) are related. The next paragraphs complement Eq. (2.35) and discuss how to interpret the DFT in Hz.