3.2 Passband Signals and the Rationale of QAM
In many communication systems, upconversion is used to translate the baseband signal to a higher frequency. This is used, for example, to decrease the antenna size as indicated in Eq. (1.8). Another reason is to share the channel via frequency division multiplexing (FDM), where each system has its own range of frequencies to operate.
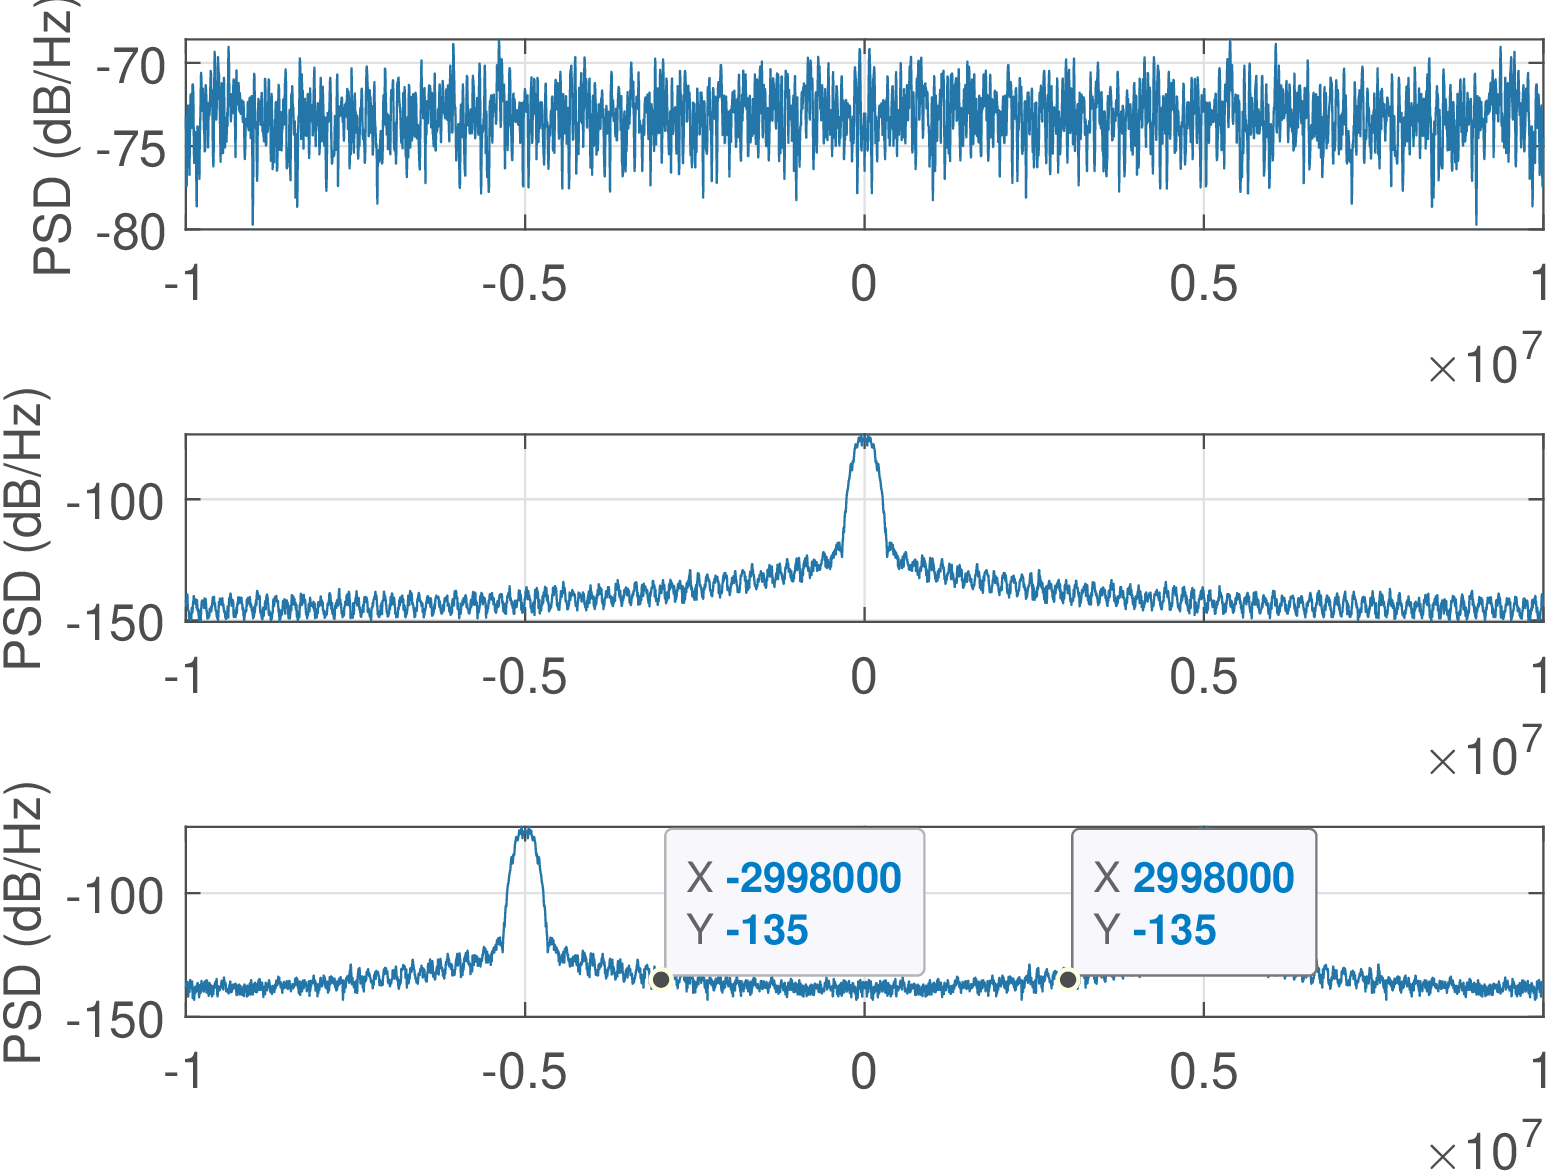
Listing 3.1 illustrates the generation of three random signals that are shaped by a FIR filter to have a bandwidth of 200 kHz. Each signal is then multiplied by carriers of frequencies 3, 5 and 8 MHz. Figure 3.1 illustrates this process considering one of the signals, where the two data cursors at approximately 3 MHz indicate that the PSD has symmetry because the signal is real.
1N=10000; %number of samples
2Fs=20e6; %sampling frequency in Hz
3Ts=1/Fs; %sampling period in seconds
4t=0:Ts:(N-1)*Ts; %discrete-time axis
5x1=randn(1,N); %3 distinct white Gaussian noises
6x2=randn(1,N); %with a band that ranges from 0 to 2*pi rad
7x3=randn(1,N);
8b=fir1(150,100e3/(Fs/2)); %cutoff frequency of 100 kHz
9%Note fir1 defines the cutoff as the frequency of -6 dB
10y1=filter(b,1,x1); %generate band-limited signals
11y2=filter(b,1,x2);
12y3=filter(b,1,x3);
13c1=2*cos(2*pi*3e6*t); %carriers at 3, 5 and 8 MHz.
14c2=2*cos(2*pi*5e6*t); %Multiply by 2 to compensate that...
15c3=2*cos(2*pi*8e6*t); %the impulses have area 1/2
16zz=y1.*c1 + y2.*c2 + y3.*c3; %FDM signal
17Pzz=pwelch(zz,[],[],[],Fs,'twosided'); %calculates the PSD
18deltaF=Fs/length(Pzz); %interval in Hz
19f=-Fs/2:deltaF:Fs/2-deltaF; %discretized frequency axis
20plot(f,fftshift(10*log10(Pzz))); %negative and positive frequencies
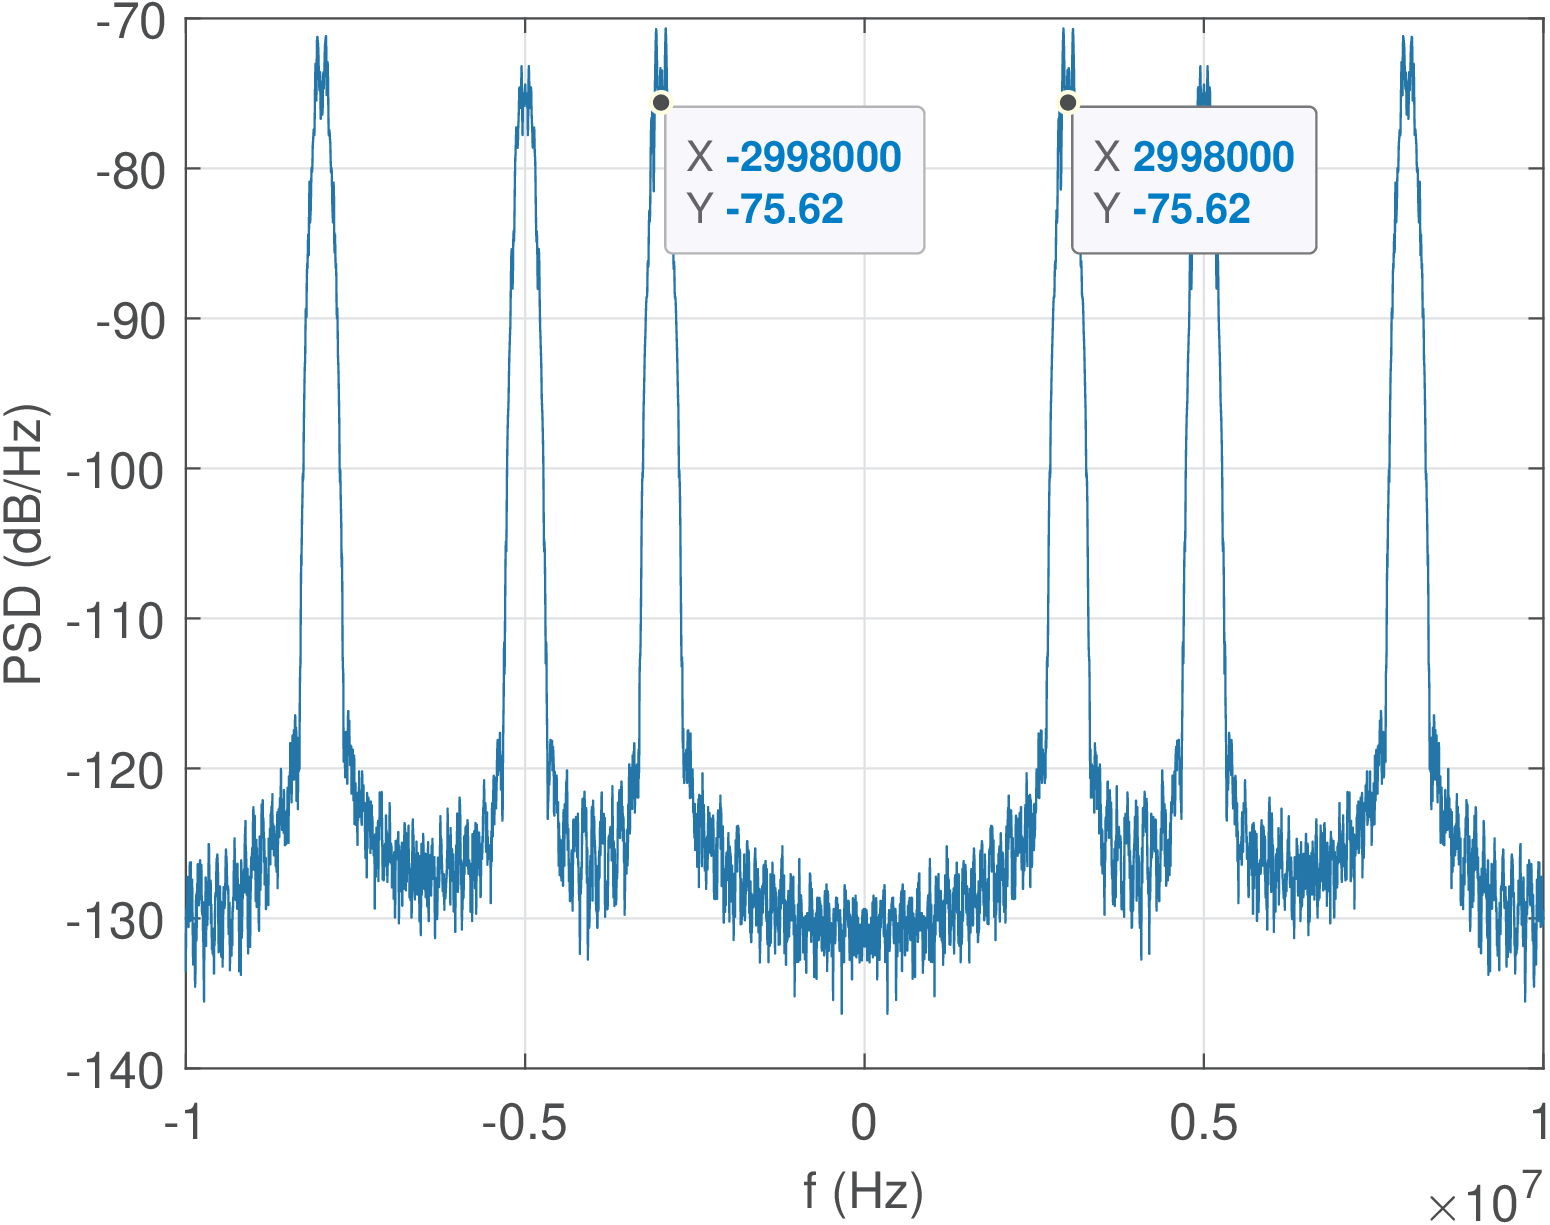
Figure 3.2 shows the complete FDM signal with three channels of 200 kHz. Each individual baseband signal could then be (approximately) recovered via downconversion and filtering. However, note that the upconversion doubled the bandwidths, as discussed for AM in Section 1.3.
As indicated in the last lines of Listing 3.1, the PSD depicted in Figure 3.2 was obtained with the pwelch function using the ’twosided’ option and specifying MHz. In this case, by default, the output graph of pwelch has abscissa from 0 to Hz. The fftshift function was used to have the abscissa from to . A similar procedure was used in Figure 3.1.
The spectral efficiency for baseband PAM is defined as
|
| (3.1) |
and is useful for comparing communication systems.
The baseband signals have a bandwidth of kHz, while the respective passband signals have kHz. Assuming the baseband signal was a PAM with bits per symbol and kbauds, then kbps. In this case, the spectral efficiency of the baseband signal is kk bits/s/Hz. For the specific example being discussed, the upconversion generates a double-sideband (DSB) passband PAM with , which is half of the efficiency of the baseband signal.
Halving the spectral efficiency of PAM is a disadvantage of upconversion. It can be noted that the passband DSB-PAM has redundancy because the original baseband signal had Hermitian symmetry in its spectrum. An alternative to combat the decrease in and eliminate the redundancy is to use single-sideband (SSB) PAM instead of the DSB. Another alternative, which is more popular because it is simpler than SSB-PAM, is to use passband QAM. While SSB-PAM tries to reduce the bandwidth, the passband QAM uses twice the baseband bandwidth but transmits two independent signals, potentially doubling the bit rate. Passband QAM is discussed in the sequel.